This is the power gap: explore the investigative series and data
The first equal pay legislation in Canada passed in 1951, making it illegal to pay men and women in the same job different salaries. Women overtook men among university graduates three decades ago. Today, women represent just under half of the workforce. And yet, men still dramatically outnumber, outrank and outearn women.
Theglobeandmail.com
Jan. 25, 2021
Robyn Doolittle
What is the Power Gap?
It’s been 70 years since Ontario became the first jurisdiction in Canada to pass pay equity legislation. Fifty years since governments began enacting laws that banned discrimination in hiring, firing and promotions on the basis of sex. Forty years since the federal government made it illegal for employers to fire a woman for becoming pregnant. Thirty years since women overtook men in university graduating classes. And it’s been 10 years since the wage gap budged in any significant way.
For women in the workplace, progress has stalled. By almost every metric, they continue to lag generations behind men.
Two and a half years ago, the Globe and Mail set about trying to understand why. What we found is that inequities run much deeper than compensation or a lack of female CEOs.
There is a power gap in the modern work force.
In an unprecedented analysis of hundreds of public sector salary records, The Globe has found that women continue to be outnumbered, outranked and out-earned by men not just at the very top, but on the way to the top and in the middle.
There are more men serving as supervisors, managers, senior managers, directors, executive directors and vice-presidents. More men on executive teams and at the helm of institutions. More men in six-figure jobs. And when comparison was possible, The Globe found that in a majority of cases, men were earning more than their female counterparts -- women who worked for the same company and at the same management rank.
A two-and-a-half year investigation by The Globe and Mail into the wage gap has revealed a bigger problem: The Power Gap between men and women at Canada’s public institutions. Investigative reporter Robyn Doolittle runs through some of the key takeaways of how and where men outnumber, outrank and out-earn women in Canada.
The Globe collected salary records from 244 entities in four key pillars that shape Canadians’ lives -- 82 universities, 25 cities, seven provincial governments and 130 public corporations -- and then married this information with gender-probability statistics (about 90 per cent of first names in Canada are associated with a particular gender at least 95 per cent of the time). The Globe’s analysis is the first of its kind and the most detailed picture available of where women stand in the Canadian workplace. (We targeted the public sector because this is the only workplace salary data available to scrutinize.)
Only high-earning public employees in provinces with legislation are subject to disclosure. Usually, the threshold is $100,000. In jurisdictions with a lower bar, The Globe only captured employees who earned six-figures. The federal government, the territories, and the provinces of New Brunswick and Prince Edward Island have no sunshine laws. In Quebec, organizations are only required to release data for their most senior employees. The Globe’s dataset is connected to the 2017 and 2017/2018 fiscal years, depending on the respective entity’s disclosure practices. (Read more about our methodology.)
To capture a full picture of what’s happening in each workplace, The Globe assessed the data through multiple lenses: the overall number of men and women among six-figure earners; the gender divide at different salary bands; the number of women working in executive decision-making roles (the “power positions”); the gender divide at the very top; the divide between white women and women of colour; and the wage gap at each level. This framework was used to evaluate each individual entity, as well as each of the four pillars. Because Quebec -- with the exception of the City of Montreal -- only releases data for the most senior earners, these organizations could not be used in calculations that required the full work force. Quebec entities are included in “power position” and “top leader” findings. (Montreal agreed to release the first -- but not last -- names of its employees so we could complete the gender analysis.)
Although the results varied by entity, there was a clear big-picture trend. Men are still making more money than women, although the difference is typically small (low single digits). However there are dramatically more men in high-paying jobs. Of the 171 organizations that disclosed full workplace data, men outnumbered women at 84 per cent of them and out-earned women on average 68 per cent of the time. Among the power positions at those entities -- the executive leadership team and president -- men outnumbered women at 71 per cent of the entities. (And in 10 per cent of cases, the representation was equal.)
The Power Gap overall
Men outnumbered and out-earned women in high-income jobs in every pillar. There were also more men on executive teams and at the helm of organizations. There were a handful of exceptions -- institutions where women outnumbered men -- but even in those entities, women struggled to rise. Of the 24 organizations that had more women earning six figures than men, only 11 had more women on their leadership teams. (In four cases, the split was even, and two had no executives to analyze.)
That women are underrepresented among presidents and CEOs in the private sector is well known. That trend held true in the public sector. Of the 237 cities, corporations and universities in our dataset, 226 had a “top leader” on their salary disclosure. Of those, 166 were led by men. Of the six provincial governments that release detailed data, there were 136 deputy ministers, the top civilian position; of those, 80 were men. Among the organizations being run by women, only six were led by racialized women, and three deputy ministers were women of colour. (The Globe was unable to determine the racial identity of six top women leaders.) At the executive power-position level, women continued to be outnumbered among decision-makers.
The top 1 percentile
In this highest echelon, the top 1 percentile of earners from each entity, men outnumbered women by more than three to one. Because names are not a reliable indicator of race, it was not possible to assess where women of colour are within each institution, but The Globe individually contacted women in the top 1 percentile to ask how they identify racially. In total, of the 289 women in this category, just 27 identified as women of colour. In 41 cases, we could not determine race. Put another way, of the 1,059 public sector employees who are among the top 1 percentile of earners at their respective organizations, 3 per cent are racialized women.
A leaky pipeline
When people talk about the glass ceiling, it usually refers to women breaking through to the C-suite or president’s office. But The Globe’s analysis has found that women seem to be topping out as mid-level managers. In truth, the ceiling metaphor isn’t a great one, because the numbers don’t show a hard barrier women can’t cross; it’s more of a leaky pipeline. In many workplaces -- especially universities -- the leak visibly accelerates a few rungs up from the bottom. What is clear is that by the highest salary band, women are dramatically outnumbered.
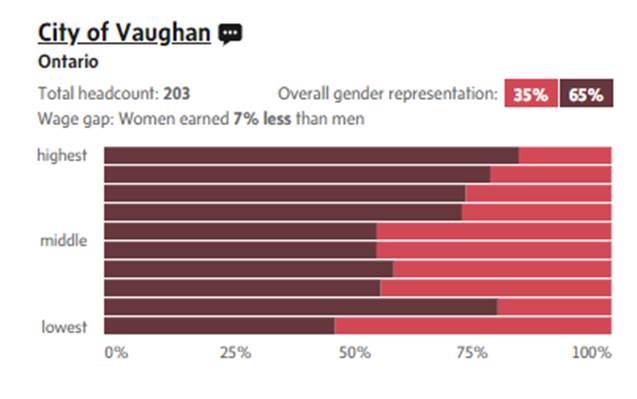
To examine the distribution of women within each workplace, The Globe assessed every entity using salary bands. Organizations with 100 or more high-income employees were split into 10, and smaller entities were divided into five. In the highest salary band, women were outnumbered at least four to one in the cities of Winnipeg, Brampton, Ont., and Vaughan, Ont., as well as at 19 universities, including the University of Windsor, the University of Ottawa, the University of Alberta, Brock University, the University of Waterloo, Western University, the University of Toronto and several other, smaller schools.
Some organizations showed sharp declines in female representation between the first and last salary band. Other entities were male-dominated from the very beginning. This was especially true with power companies.
The Power Gap in management
Another way The Globe measured power within institutions was to examine individual job titles. Across all four pillars and within most individual entities, a number of positions associated with management roles routinely showed up: supervisor, manager, senior manager, director, executive director and vice-president. Although the results varied, once again the trend showed that women were outnumbered almost everywhere.
The gender divide in Quebec
The Globe collected data from 74 entities in Quebec: 49 public corporations, five cities, 19 universities and the provincial government. However, only the City of Montreal agreed to provide the first name and salary of all six-figure earners. Every other organization only disclosed senior management, as the province’s legislation allows. Sometimes, as was the case with most corporations, this was interpreted as only one or two people. In other cases, like the municipal governments, each list had a few dozen. Because there was no consistency around disclosure, each organization is best assessed on its own. (You can find detailed Quebec entity data in the “power position” section at the bottom of each of the pillar pages.) What can be said is that of the 73 entities that provided limited data, men outnumbered women among the senior ranks two-thirds of the time, and 67 per cent had a man in the top job. But of significant note, the wage gap between men and women executives was lower than the average outside of Quebec.
The Globe reached out to every entity in our database that provided detailed information for comment. You can read their responses here. A few dozen have not responded. The Globe will continue to update this dataset as new information arises.
EXPLORE THE POWER GAP IN CANADIAN MUNICIPALITIES
The Globe and Mail collected data from the 25 largest cities in Canada
About 80 per cent of Canadians live in cities. And if you’re one of those people, perhaps no level of government has more impact on your daily life. From transit and housing to daycare and infrastructure, shelters and cultural events to recreation programs and facilities, everything flows through city hall. Municipal civil servants plan how the city looks, where the parks go, and what rules developers have to follow. They decide when snow gets cleared, when your garbage gets picked up, and your local tax rate. You want to renovate your house? Get a marriage licence? Pay a parking ticket? Lobby for a new bike lane? Have a pothole filled? It’s all done through city hall.
The Globe and Mail collected data from the 25 largest cities in Canada that provide disclosure. The largest was Toronto, with nearly 3 million residents; the smallest was Sherbrooke, with about 160,000. Calgary, Edmonton, Surrey, B.C., and Richmond, B.C., were not included because they either don’t release information or the disclosure did not include job titles. (Longueuil was excluded because their disclosure was less than 10 people.) Knowing job titles was necessary because early analysis showed that some municipalities lumped emergency services (police, fire and ambulance) in with regular municipal employees. Particularly with police and fire, these male-dominated professions dramatically skewed the numbers. In some cases, about half of all the employees on municipal disclosure lists were firefighters. For this reason, The Globe worked with each municipality to filter out emergency services.
Only high-income earners are included in public sector salary disclosure. In most cases, it applies to employees who earn $100,000 or more. In provinces with a lower threshold, The Globe removed the employees below that six-figure bar. With the exception of Montreal, the four other cities in Quebec were excluded from the wider salary analysis, because they only released information for the most senior staff. These entities could be included in the gender breakdown of the “power positions.” (Montreal agreed to release the first -- but not last -- names of its employees so we could complete the gender analysis.) The Globe’s data comes from the 2017 or 2017/2018, depending on how the organization handles its fiscal year. (Read more about our methodology.)
The Power Gap
In general, women were outnumbered two to one in municipal governments, although the overall wage gap was non-existent. At the executive level, it was a similar story, although male decision-makers did earn more. (When calculating the gender divide among “power positions,” the Globe included the president in the overall representation number, but not the average salary.)
Breaking down the Power Gap
To better understand where women are in the workplace, the Globe assessed each entity’s gender representation at individual salary levels. Large entities -- those with 100 or more six-figure earners -- were examined with 10 bands. Smaller ones with five.
Municipal governments showed a different pattern than entities in other pillars. As was the case elsewhere, the number of women in the pipeline started to shrink on the way to the top. But in many cities, women’s numbers rebounded toward the end. Some experts interviewed by The Globe speculated that this could be evidence of employers making efforts to diversify their senior ranks -- the layer that also happens to be most visible to the public. The other element of note is that the gender divide held relatively steady at each salary band. However, women were underrepresented to begin with among high-income municipal employees. At every level, women are outnumbered about two to one.
Overall representation by salary range in Canadian municipalities
Total headcount: 9,113
For each city, the Globe analyzed the top 1 percentile of earners. On average, women were again outnumbered two to one at this salary threshold. Of the 30 women in this category where the Globe could determine race, 2 are women of colour.
Overall representation by top 1 percentile earners in Canadian municipalities
Total headcount: 107
All top 1 percentile earners - 107 people
Digging deeper
Below, you can explore the gender breakdown at individual cities and filter the results by province. In about half of the cities, women’s numbers increased in the final salary band. The most extreme example was Windsor, Ont., where women initially made up just 18 per cent of the lowest salary band, but 60 per cent in the highest.
The Power Gap on leadership teams
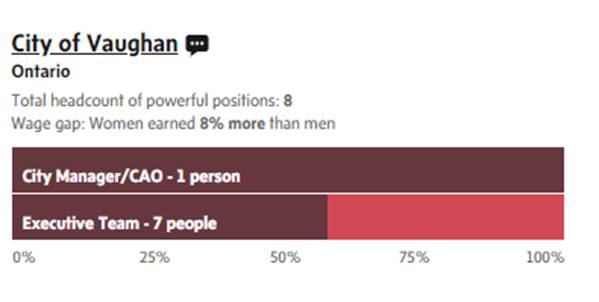
Using common job title keywords -- such as city manager, chief administrative officer, deputy city manager, commissioner, and director -- and publicly-available organizational charts and executive team biographies, The Globe identified employees that held key decision-making roles at each city. These are the executive “power positions.” (A reminder that Quebec’s disclosure included data for senior positions, so those entities could be included in this section.) The gender divide among municipal leadership was 38 per cent, but the number of female city managers was abysmal: just two out of 25 cities.

- © 2019 City of Vaughan. All Rights Reserved.