Share of Torontonians taking public transit is on the rise, while reliance on cars declines
New census data shows the same trend is happening across the GTA and comes despite the lack of major new transit projects in the region.
TheStar.com
Nov. 29, 2017
Ben Spurr and Matthew Cole
The portion of Torontonians who drive to work has declined over the last decade while the portion commuting by public transit has increased, signalling that even without the construction of major new transit infrastructure during the past 10 years the city is moving in the right direction when it comes to decreasing residents’ reliance on the car.
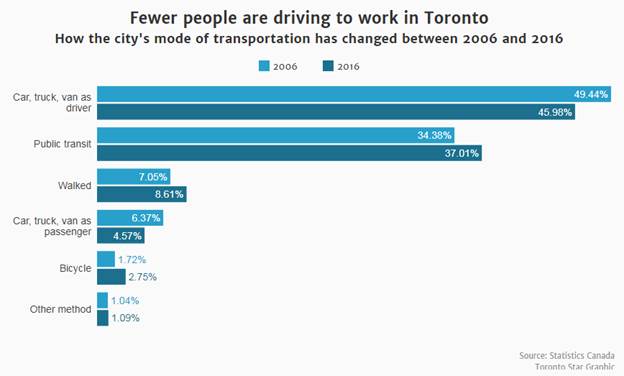
According to 2016 long-form census data released Wednesday by Statistics Canada, the share of Torontonians who drive their own car, truck, or van to work decreased by 7 per cent in the 10 years since 2006. Over the same period, the share of people commuting by transit increased by 7.7 per cent.
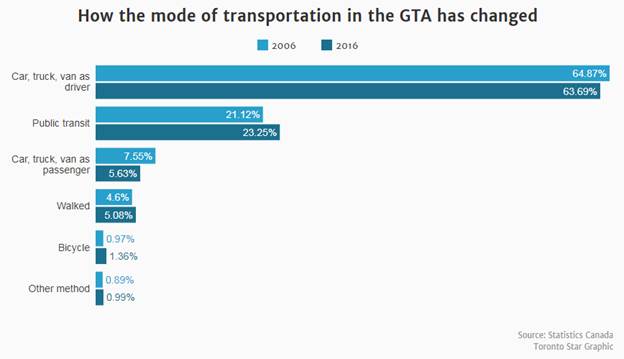
The Greater Toronto Area saw the same trend, although the drop in the portion of commuters who drove was less pronounced. Across the GTA, the portion of those commuting by private vehicle fell 1.8 per cent since 2006, while public transit use rose by 10.1 per cent.
The trend will be hailed as positive by policy makers intent on reducing the congestion and greenhouse gas emissions associated with private automobiles, and comes despite the fact that no major transit projects have opened in Toronto over the past decade. Line 4 (Sheppard) is the most recent addition to the TTC subway network, and it carried its first passengers in 2002.
Jason Gilmore, chief of labour statistics at Statistics Canada, said there could be a number of factors driving the shift away from cars and towards public transit. One contributor is likely that Toronto’s population is simply becoming more dense.
“The more dense your environment becomes, the more challenging it is to get around. So… it’s possible some people are deciding rather than driving through an increasingly dense environment, they’re deciding to choose public transit,” he said in an interview Wednesday.
“It could also be environmental decision making. People might choose to (take transit) to have less of an impact on the environment.”
There are signs the shift towards transit may not continue far into the future, however. Like many public transit agencies across the continent, in recent years TTC ridership growth has begun to falter, and the number of annual trips is holding steady at about 540 million. In 2017, for the first time in more than a decade ridership may actually be lower than the year before. It’s difficult to determine how overall ridership is tied to commuting patterns however, as the TTC ridership figures capture trips for all purposes, not just those for work.
In February, the transit agency is expected to release a strategy to kickstart ridership growth, although no funding for it is included in the 2018 budget the TTC board approved on Tuesday.
A number of new transit projects are about to come online and could allow ridership to grow. An extension of Line 1 (Yonge-University-Spadina) will enter service next month, while the Eglinton Crosstown LRT is scheduled to open by 2021, followed closely by the Finch West LRT.
At the regional level Metrolinx, the provincial transit agency for the GTA, is hoping to get more suburban commuters out of their cars and onto transit with a major expansion of GO Transit service that will see the number of weekly train trips quadruple to 6,000 from 1,500 by 2025.
Despite the decrease in the portion of people using their car to get to work, driving remains the dominant mode of commuting in both Toronto and the wider GTA. In Toronto, 41 per cent of workers drive their car to work without any passengers, while 37 per cent use public transit. Solo driving is even more popular in the wider GTA, with 57.8 per cent of commuters taking their car to work alone, and fewer than one in four riding transit.
The census data also showed that it is taking the region’s commuters more time to get to work despite the fact that the average distance between their home and place of business decreased slightly between 2006 and 2016, falling from 14.8 kilometres to 14.6 kilometres.
According to the data, it took GTA residents an average of 1 minute and 12 seconds longer to get to work last year than it did in 2011. Over that time the region’s residents saw their average one-way commute time increase by about 3.7 per cent, from 32 minutes and 36 seconds to 33 minutes and 48 seconds.
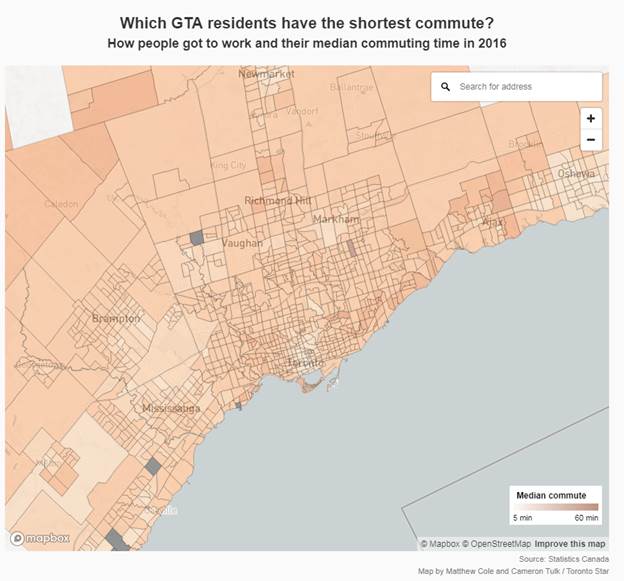
City of Toronto residents saw a smaller increase than their neighbours in the rest of the GTA, with their trips increasing by about 42 seconds, from 33 minutes and 30 seconds to 34 minutes and 12 seconds.
The decrease in private car use was not evenly distributed across 25 census districts that make up the GTA. Twelve districts recorded an increase in the portion of commuters who drive. Brock, in the northeast corner of the GTA where residents have little access to public transit, led the way with an 8.3-per-cent spike in driving’s mode share.
Although the portion of commuters who drive has declined, the population increase in the region has meant that there are more cars on the road now than there were 10 years ago. The GTA added 177,740 commuters who drive in that time, but just 8,375 of them came from Toronto, which is by far the largest municipality in the region. Brampton was responsible for the most new drivers, adding 47,095 over the past decade, or more than a quarter of the total increase.
In total, the region added 132,595 transit users over the same period.
In addition to public transit use, active transportation is also on the rise in Toronto, with more than one in 10 reporting they get to work under their own power — 8.6 per cent by walking and 2.7 per cent by cycling. Both modes saw in increase compared to 2006, when 7.1 per cent of commuters reported walking, and 1.7 per cent said they cycled.
Among the three largest cities in Canada, Toronto’s census metropolitan area (CMA) had the highest portion of people commuting by “sustainable transportation,” which Statistics Canada defined as public transit, cycling, walking, or carpooling.
In 2016, 42.5 per cent of commuters in the Toronto CMA took sustainable transportation to work, compared to 40.6 per cent in the Vancouver area, and 38.1 per cent in Montreal.
“The gap isn’t huge between the three,” said Gilmore, who described sustainable transportation use in the trio of cities as “very high.”
“Vancouver has definitely been catching up, and part of that is because they’ve had really some major expansions of public transit in the past 15 years with their SkyTrain.”
There were marked differences between the income levels of different types of commuters in Toronto. Solo drivers, who reported a median annual household income of $104,023, earned more than public transit users, whose median income was $84,875. The median income for cyclists was $92,649.
The shift away from private vehicle commuting in the Toronto area mirrors a change taking place at the national level over the past 20 years. According to Statistics Canada, since 1996, the portion of Canadians driving to work decreased from 80.7 per cent in 1996 to 79.5 per cent last year.