A majority of Torontonians now identify themselves as visible minorities
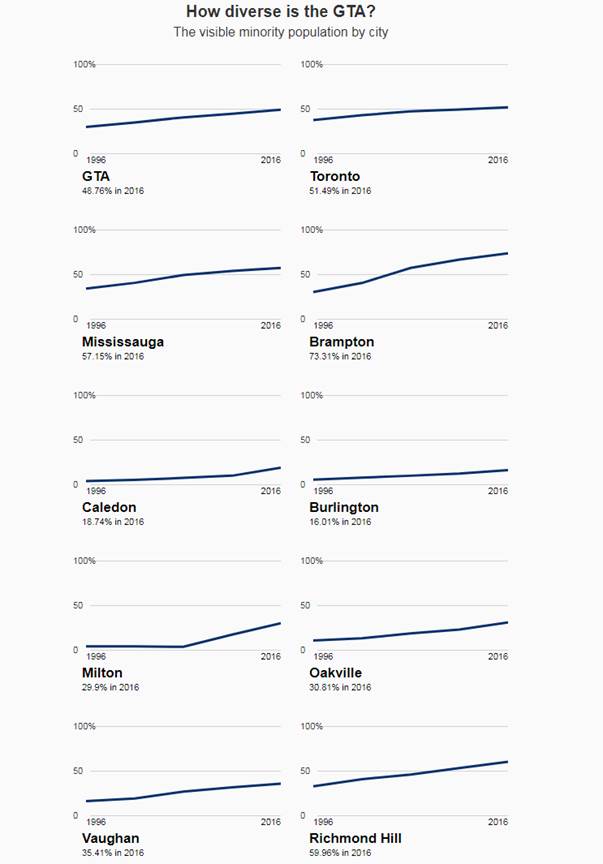
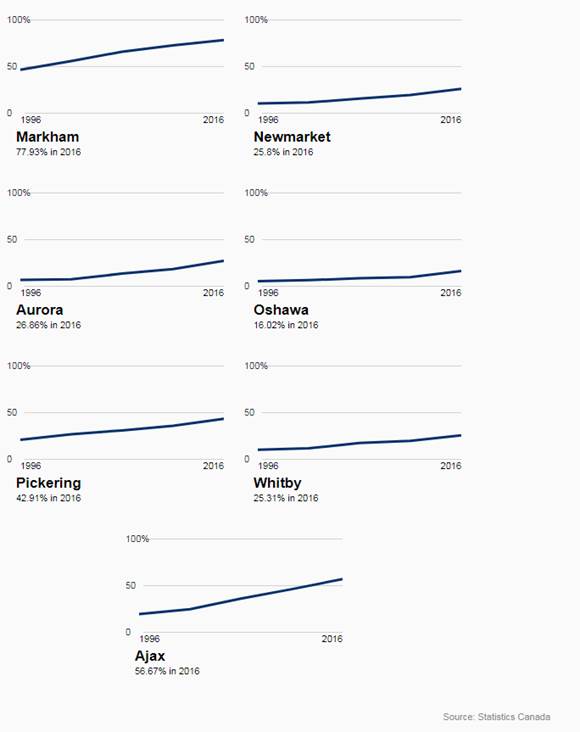
And in five of the suburban cities around Toronto — Ajax, Mississauga, Richmond Hill, Brampton and Markham — a majority of people identify as visible minorities.
TheStar.com
Oct. 25, 2017
Alex Ballingall
Most people in Canada’s biggest city now identify as visible minorities, as new census data shows increasing diversity in Toronto and many of its neighbouring suburban areas.
More than half of respondents to the 2016 census in the City of Toronto — 51.5 per cent — said they’re from visible minority communities, a milestone that was narrowly missed when 49 per cent identified that way in 2011.
The news comes as part of a tranche of census data, released Wednesday, that paints a multifaceted portrait of a country where more than one in five people was born outside its borders. Canada is now home to millions of people who claim more than 250 distinct “ethnic origins,” with historical lineages through Indigenous groups and countries all over the world.
“We’ve been seeing this for 20 years now, that Canada is becoming more and more diverse,” said Jean-Pierre Corbeil, Statistics Canada’s assistant director of social and Aboriginal statistics.
“It’s not surprising that we see the share of people identified as visible minorities… increasing for sure,” he said.
Across the GTA, almost half (48.8) per cent of census respondents identified as visible minorities.
Almost 22 per cent of the Canadian population is foreign-born, while 1.2 million people immigrated here between 2011 and 2016, the census data shows. Forty-one per cent of Canadians, meanwhile, lay claim to more than a single ancestral group, the most frequent being English, Scottish, French or Irish.
In Canada overall, more than 22 per cent of people reported in 2016 being from visible minority communities, up from 16.3 per cent in 2006 and 4.7 per cent when the government started gathering this information in 1981. Statistics Canada attributes the increase in part to an increasing proportion of immigrants from non-European countries. For example, Africa surpassed Europe as the continent-of-origin for the second-highest number of immigrants between 2011 and 2016, the data shows.
The release showed a similar trend for two groups: the largest overall increase in the Indigenous population was in western Canada over the last decade, while the share of recent immigrants to the Prairies more than doubled over the last 15 years.
“Immigrants are diffusing across the country,” said Michael Haan, a sociology professor at Western University in London, Ont.
“What it’s forcing us to do, collectively, is think about our entire nation as being composed of immigrants, rather than just major cities.”
Nearly half of major metropolitan areas are comprised of visible minorities, noticeably Toronto and Vancouver, said Doug Norris, chief demographer at Environics Analytics. But the figures are also on the rise in places such as Saskatoon, Regina, Winnipeg and Calgary, he added.
“Places that people didn’t think were culturally diverse are becoming now culturally diverse.”
The release is just the latest — and second-to-last — in a year-long series of statistical snapshots of Canada. It also marks the return of the long-form census for the first time in a decade.
The data also shows a marked difference in diversity between the multicultural heartland of the Greater Toronto Area and the rest of the country. Twenty-nine per cent of Ontarians and 22 per cent of Canadians overall reported being visible minorities, versus a thin majority in the Big Smoke.
Five of the suburban cities around Toronto — Ajax, Mississauga, Richmond Hill, Brampton and Markham — had majorities of people who identify as visible minorities. Markham posted the highest proportion (77.9 per cent), followed by Brampton (73.3 per cent) and Richmond Hill (60 per cent).
But while diversity — in terms of visible minority populations — increased in every census division in the GTA from 2011 to 2016, the numbers vary widely. Burlington and Oshawa had the lowest proportion of visible minorities for cities with more than 100,000 people, at 16 per cent each in 2016, followed by Whitby at 25 per cent and Oakville at 31.
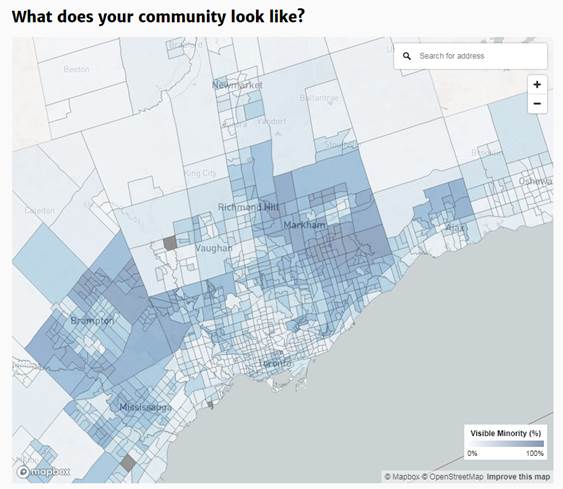
The numbers also varied in the City of Toronto. The higher proportions of diversity — more than 50 per cent — were clumped in the inner suburbs of Scarborough, North York and Etobicoke.
Several areas showed proportions of visible minority communities as high as 90 per cent, with concentrations of people who identified as Chinese, for example, in places such as Scarborough’s Agincourt neighbourhood and the city of Markham. Two neighbouring Toronto census tracts with almost 4,000 residents off Steeles Ave. E. even showed a combined 99 per cent Chinese population, one of the highest proportions of a single visible minority in the GTA.
Minorities in the GTA:
More than half of 2016 census respondents in Toronto — 51.5 per cent — said they’re from visible minority communities: Here’s how the numbers break down:
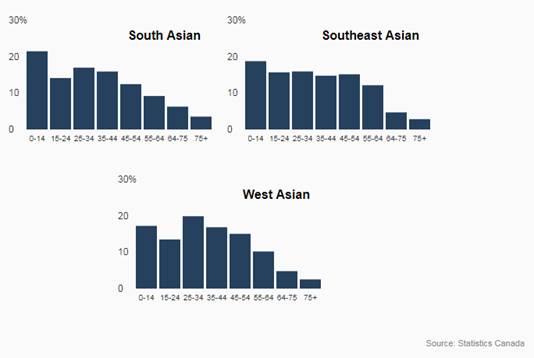
- South Asian: 12.59 per cent
- Chinese: 11.13 per cent
- Black: 8.91 per cent
- Filipino: 5.67 per cent
- Latin American: 2.87 per cent
- Arab: 1.34 per cent
- Southeast Asian: 1.55 per cent
- West Asian: 2.24 per cent
- Korean: 1.55 per cent
- Japanese: 0.5 per cent
- Visible minorities not included elsewhere: 1.37 per cent
- Multiple visible minorities (people who belong to more than one group): 1.77 per cent
In Canada overall, the largest visible minority communities were South Asian (1.9 million people), Chinese (1.6 million) and Black (1.2 million).
Highlights:
- In 2016, 7.5 million people — about 21.9 per cent of the total population — reported being foreign-born individuals who immigrated to Canada. In 1921, the census reported that proportion at 22.3 per cent, the highest since Confederation. Statistics Canada projects that proportion could reach between 25 and 30 per cent by 2036.
- The census counted 1,212,075 new immigrants who permanently settled in Canada between 2011 and 2016, 3.5 per cent of the total population last year.
- 60 per cent entered under the economic category, 26.8 per cent to join family already in Canada and 11.6 per cent as refugees. During the first four months of 2016, refugees accounted for one-quarter of all immigrants admitted to Canada, thanks to an influx of refugees from Syria.
- Asia, including the Middle East, remains the largest source of recent immigrants to Canada at 61.8 per cent, followed by Africa at 13.4 per cent. Europe — once dominant in this category at 61.6 per cent in 1971 — ranked third at 11.6 per cent.
- More immigrants have been settling in the Prairies. The percentage of new immigrants living in Alberta reached 17.1 per cent in 2016, compared with 6.9 per cent in 2001; In Manitoba, it went to 5.2 per cent, up from 1.8 per cent, and four per cent in Saskatchewan, up from one per cent in 2001.
- Visible minorities numbered 7.7 million in 2016, 22.3 per cent of Canada’s population. 30 per cent were born in Canada.
- In 1921, more than 70 per cent of the foreign-born population reported English or French as a mother tongue, while fewer than 30 per cent reported a different language. In 2016, the precise opposite was true: more than 70 per cent reported a different mother tongue, compared to less than 30 per cent for English or French.
- In 2016, nearly 2.2 million children under 15 — 37.5 per cent of all children in Canada — were either foreign-born themselves or had at least one foreign-born parent.
- Some 1.9 million people reported being of South Asian heritage, fully one-quarter of the visible minority population. Chinese was the second-largest group at 1.6 million or 20.5 per cent of visible minorities, while blacks — surpassing the one-million mark for the first time — were third at 1.2 million, a share of about 15.6 per cent. Filipinos and Arabs rounded out the top five.
- More than 9.5 million of the 14.1 million households in Canada owned their home in 2016, a rate of 67.8 per cent, down slightly from 69 per cent in 2011. However, rates varied widely depending on age: 70 per cent of homeowners in 2016 were aged 35-54, compared with 20- to 34-year-olds at just 43.6 per cent.
- Condos are most popular in Vancouver, where they comprised 30.6 per cent of all local households. Calgary was second at 21.8 per cent, followed by Abbotsford-Mission, B.C., at 21.5 per cent, Kelowna at 21.3 per cent and Toronto at 20.9 per cent.
- In 2016, 24.1 per cent of households — down from 24.4 per cent in 2006 — were spending 30 per cent or more of their average monthly total income on shelter costs, such as rent or mortgage payments, electricity, heat and property taxes or fees. Of those, the highest proportions were in Toronto (33.4 per cent) and Vancouver (32 per cent).
- The census counted 1.67 million Indigenous people in Canada in 2016, accounting for 4.9 per cent of the total population — up from 3.8 per cent in 2006 for a growth rate of 42.5 per cent over the last 10 years, four times the rate of the non-Indigenous population.
- The number of people who identified as First Nations reached 979,230 last year, up 39.3 per cent over 2006, while the Metis population grew by 51.2 per cent over the same period to 587,545 people. The census recorded 65,025 Inuit, 29.1 per cent higher than in 2006.
- Winnipeg (92,810), Edmonton (76,205), Vancouver (61,460) and Toronto (46,315) reported the largest Indigenous populations, while the highest proportion of Aboriginal people were in Thunder Bay (12.7 per cent), Winnipeg (12.2 per cent) and Saskatoon (10.9 per cent).