Census 2016: The growing age gap, gender ratios and other key takeaways
Statistics Canada reports that Canadians are increasingly living in apartments, amid affordability concerns. Tavia Grant and Jeremy Agius explain the highlights
TheGlobeAndMail.com
May 4, 2017
Tavia Grant and Jeremy Agius
The greying of Canada’s population is accelerating, as new census numbers show seniors now outnumber children for the first time in the survey’s history.
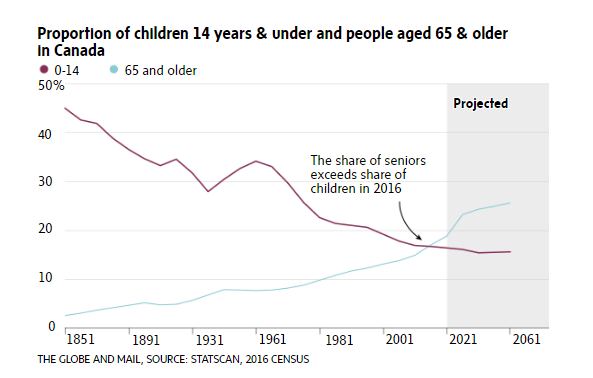
The 2016 census from Statistics Canada, released Wednesday, shows the largest increase in the share of seniors since the first census after Confederation. The proportion of those aged 65 and older climbed to 16.9 per cent of Canada’s population, exceeding the share of those under 15 years old at 16.6 per cent.
Meantime, the portion of the working-age population – those between the ages of 15 and 64 – declined to 66.5 per cent from 68.5 per cent in the 2011 census.
The latest batch of census data – on age, sex and dwelling type – also shows rapid increases in Canadians who are over the age of 100 and fewer Canadians living in single detached homes, the result of declining affordability and older people moving into smaller living spaces. It shows the territories and the Prairies have the youngest populations, while the Atlantic provinces have the highest share of seniors in the country.
Across Canada, the increase in the share of seniors since the last 2011 census “was the largest observed since 1871 – a clear sign that Canada’s population is aging at a faster pace,” Statistics Canada said in its release Wednesday.
The accelerating pace of aging in the population carries profound implications for everything from government budgets to pensions, health care, the labour market, consumer trends and social services.
“While the greying of Canada is not new, it’s starting to have a bigger and bigger impact,” said Doug Norris, chief demographer at Environics Analytics, in an interview before the census release. This shift has big implications for businesses, he added, which will have to increasingly focus on “older, empty nester, single-person households.”
The 2016 census counted 5.9 million seniors, compared with 5.8 million children who were 14 or younger.
Looking ahead, population projections show the gap between the two age groups will widen. By 2031, almost one-in-four Canadians could be 65 or older, while the share of children would remain similar to 2016 levels, at 16 per cent, the agency said. The share of the working-age population – Canada’s tax base – will likely “continue to decrease,” Statscan said.
That rapid aging in the coming decades means the share of seniors “could eventually equal the level now seen in Japan.”
Despite the acceleration in Canada’s aging population, the country still has a lower share of seniors than in any other G7 country except the United States, Statscan said.
Aging by province
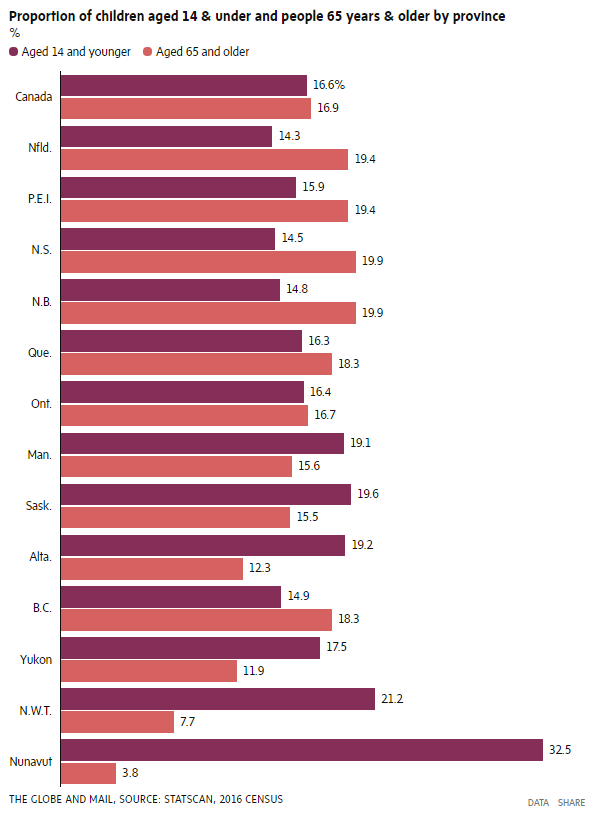
Age trends vary considerably by region, province and city.
In the past five years, the Atlantic provinces have seen the most dramatic changes in the country, amid “low fertility, low immigration levels and migratory losses to other regions of Canada.”
As a result, the region saw the biggest drop in the share of working-age people in the five-year period, and the biggest increase in the portion of seniors.
The difference in the share of seniors in Atlantic Canada and in Alberta – the province with the youngest population – is the largest since Confederation, Statscan said.
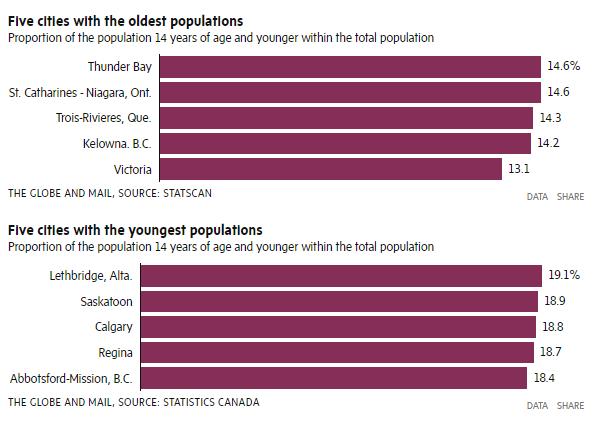
The cities with the greatest share of children aged 14 and younger are in Lethbridge, Alta., Saskatoon, Calgary and Regina. The cities with the oldest populations are in Trois-Rivières, Que., Peterborough, Ont., St. Catharines-Niagara, Ont., and Kelowna, B.C.
British Columbia is increasingly becoming a retirement destination. Seven of the top 10 municipalities with the largest share of people over the age of 85 are in B.C. Four of those are on Vancouver Island, “a region well known for attracting many seniors, partly because of its climate,” the agency said.
Working age
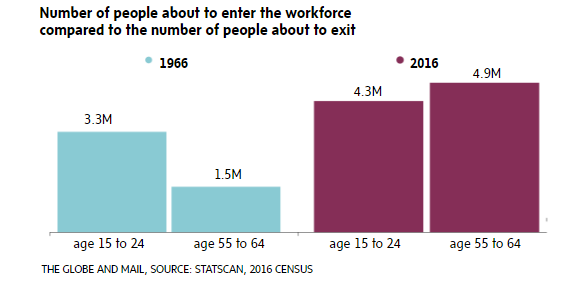
Canada’s working-age group is shrinking as a share of the total population.
The number of Canadians aged 15 to 64 rose just 0.4 per cent between 2011 and 2016 – the smallest increase in relative terms since 1851. The working-age portion of the population fell to 66.5 per cent from 68.5 per cent in 2011.
That shift poses real challenges for governments, which must rely on a shrinking tax base at a time when pressure on services, particularly health care, is growing.
Still, Canada fares better than other G7 nations in this respect. Canada has the highest portion of working-age people of all G7 countries, partly due to high immigration levels.
Age pyramid
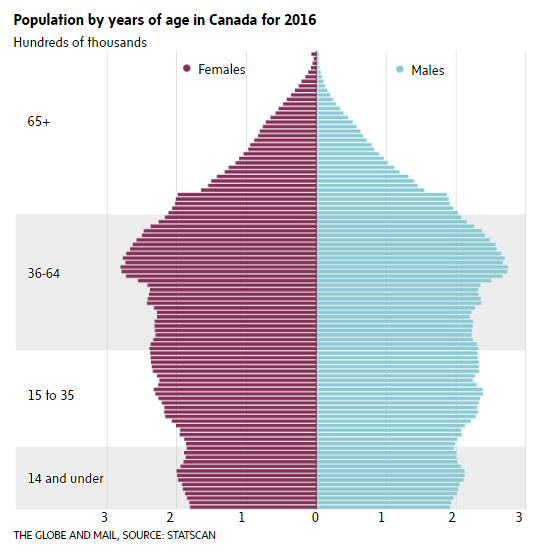
In 2011, the first baby boomers turned 65. This led to a 20-per-cent jump in the number of seniors in 70 years. In contrast, Canada’s total population rose by 5 per cent in the five-year period while the number of kids rose by 4.1 per cent.
Canada has seen three decades of sustained immigration, which has boosted population levels. But that has had little effect on aging population trends, the agency noted, because immigration flows have been quite stable since the 1980s. Most immigrants come to Canada in their thirties, and grow older in the country.
Centenarians – those aged 100 or older – were the fastest growing population, with this age group jumping 41.3 per cent amid rising life expectancies. As of 2016, Canada had 8,230 centenarians.
Among those aged 100 and older, there were five women for every man, Statscan said, as women still have longer life expectancies than men. By 2051, the number of centenarians could reach nearly 40,000 – about five times higher than in 2016, the agency projects.
Dwellings
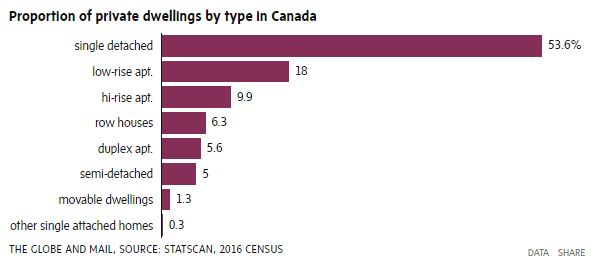
Most Canadians still live in single-detached homes, though that share is declining. The share of these homes fell to 53.6 per cent from 55 per cent in the previous census.
This share “has been declining over the past three decades,” the agency said, most notably in B.C.
The share of apartments in Canada rose to 33.5 per cent in 2016, up from 32.6 per cent in 2011.
Dwelling by city
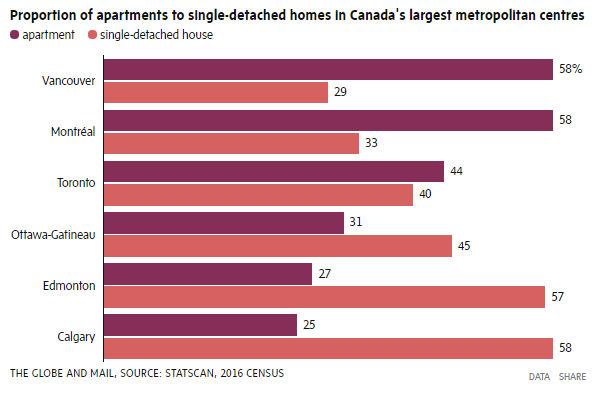
More people are living in apartments – particularly in Canada’s largest cities. In Toronto, nearly three in 10 dwellings are in high-rise buildings, making it the city with the largest proportion of high-rises in the country.
Canada’s housing market has seen massive shifts in the past five years, and rapid price gains in Toronto in particular over this past year have sparked concern over a possible correction.
More people are opting for apartments as they grow older, and amid affordability concerns. Average house prices rose 35.3 per cent in the five-year period, to $489,777, according to the Canadian Real Estate Association.
Gender
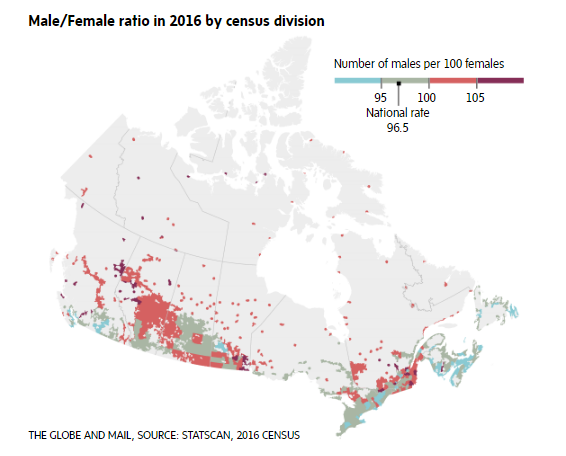
Gender ratios differ too, depending on location and age.
Cities with older population tend to have higher concentrations of women. This explains why many municipalities on Vancouver Island – such as Parksville and Oak Bay – have more women than men.
Perth, Ont., has the highest share of women in Canada, where there are 80 men per 100 women.
Across Canada, among those aged between 85 and 99, there are just 54 men for every 100 women. Among centenarians, there are only 19 men for every 100 women.
Higher concentrations of men tend to be in places with prisons, military bases and sports infrastructure, such as ski resorts, Statscan said. Kent, B.C. – home to two federal penitentiaries – has the highest share of men in Canada.