![]()
We Mapped the City’s 311 Requests
Noise, damaged green bins, and furniture missed during garbage pick up are some of the things Torontonians reported in 2014.
Torontoist.com
Nov. 16, 2016
James Steenberg
Toronto decided to open up its municipal databases in 2009. That is to say, the City decided to adopt the open data and open government movement that has been sweeping the country over the past several years.
Basically, governments—especially municipal ones—are opening up by making the data they use to govern available to the public. You can now see these values enshrined in Prime Minister Justin Trudeau’s “open by default” data policies.
Doing so makes sense, given the fact that these data sets are generated using taxpayer dollars. But there are other underpinning principles of open data, like improved government transparency, accountability, civic engagement, and the like. One open data perk of particular note is the civic hackathon, where data nerds get together to develop cool new apps to improve city living using municipal open data.
Arguably, one of the more insightful data sets included in Toronto’s open data portal is the 311 service requests—data that literally lists everything that Torontonians have asked of their local government. I happen to count myself among the ranks of the aforementioned data nerds, so I decided to map what people were asking for when using 311 in 2014.
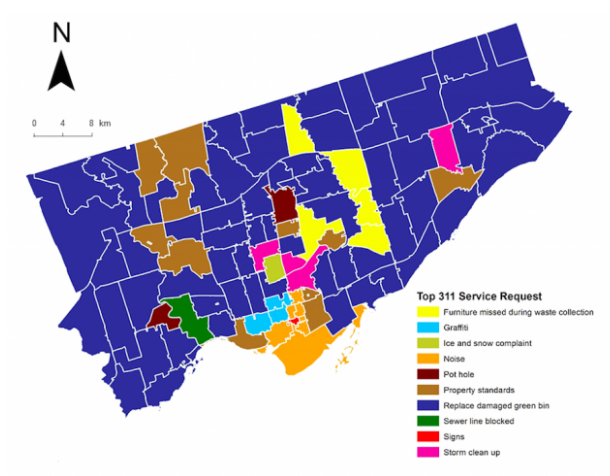
The map below shows the most common request in each of Toronto’s forward sortation areas—areas delineated by the first three digits of a postal code.
One of the things I do for my day job as a postdoc is look at the ways open data can help us understand how interacting social and ecological forces shape the city’s natural environment. I was justifiably—perhaps shamelessly—thrilled to see the spatial patterns emerging from the 311 data.
Blocked sewer lines are clustered around the Humber River delta and flood plain, where major downpours overburden Toronto’s watersheds and sewersheds. The Humber River drains the extensive swaths of Etobicoke, Brampton, and Vaughan, and stormwater falling on all those paved, impervious surfaces comes barreling downriver in high volumes and has apparently taken its toll.
The noise associated with downtown living is certainly not falling on deaf ears among surrounding condo and apartment dwellers. The same appears true with Toronto Island residents, but hey, they’ve got things pretty good otherwise.
There are a few anomalies that beg further investigation. For instance, the “Eastern Furniture Belt” shown in yellow that tracks the Don River reveals an apparent problem with furniture pick up on garbage day.
In the red-coloured “Bay Street Signage Hotspot,” top 311 requests are coded only with the word “signs.” This might lead us to one of two conclusions: traffic signals are inadequate or those Bay Street financial types simply demand more from their signage.
Perhaps most importantly, mapping 311 requests has revealed the absolute carnage being wreaked by Toronto’s raccoons on our population of green bins. By far, the most frequent request across the city is to replace a damaged green bin. (Keep in mind, this data set is from before the green bin offensive of 2016.) These results serve only to reinforce Toronto’s raccoon culture.
Anecdotes aside, there is tremendous value in using open data for understanding and managing Toronto’s natural environment. The sheer volume of data collected by the city—including 311 data—can enable government and communities alike to keep a finger on the pulse of potential environmental hazards. For instance, calls for tree maintenance and removal spiked after the ice storm of 2013 in many spots across the city. These patterns can highlight future risk by showing where aging tree populations need some extra care from arborists.
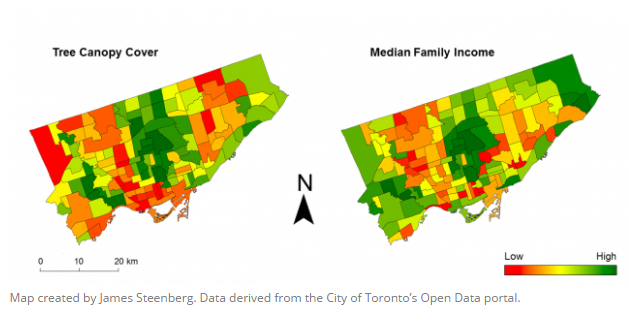
Wellbeing Toronto is another city initiative and mapping website that leverages open data. The intent is to let citizens visualize and compare data describing things like education, employment, income, and housing prices in their neighbourhood.
Again from an environmental perspective, this might let Torontonians see where inequities exist in their city with regards to who has—and who doesn’t have—access to trees and green spaces, along with the beneficial ecosystem services they provide.
Municipal governments are increasingly becoming open, but we’ve only begun to understand the ways in which open data can help us to comprehend and manage city environments.